Circulation#
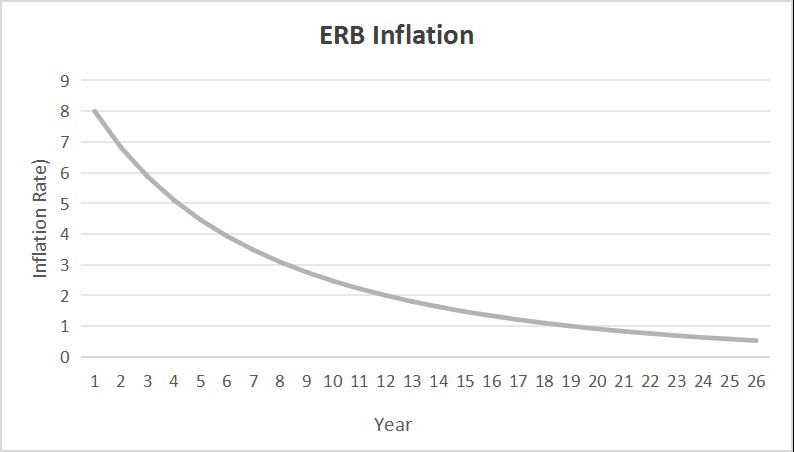
The ErbieChain’s Inflation Schedule is uniquely described by three parameters: Initial Inflation Rate, Disinflation Rate and Long-term Inflation Rate.
A large portion of the ERB issued via inflation will be distributed to stake-holders in proportion to the ERB they have staked. We want to ensure that the Inflation Schedule design results in reasonable Staking Yields for token holders who delegate ERB and for validation service providers (via commissions taken from Staking Yields).
The primary driver of Staked Yield is the amount of ERB staked divided by the total amount of ERB (% of total ERB staked). Therefore the distribution and delegation of tokens across validators are important factors to understand when determining initial inflation parameters.
The rate at which we expect network usage to grow, as a consideration to the disinflationary rate. Over time, we plan for inflation to drop and expect that usage will grow.
Based on these considerations, the Erbie team has formulated the following inflation plan parameters:
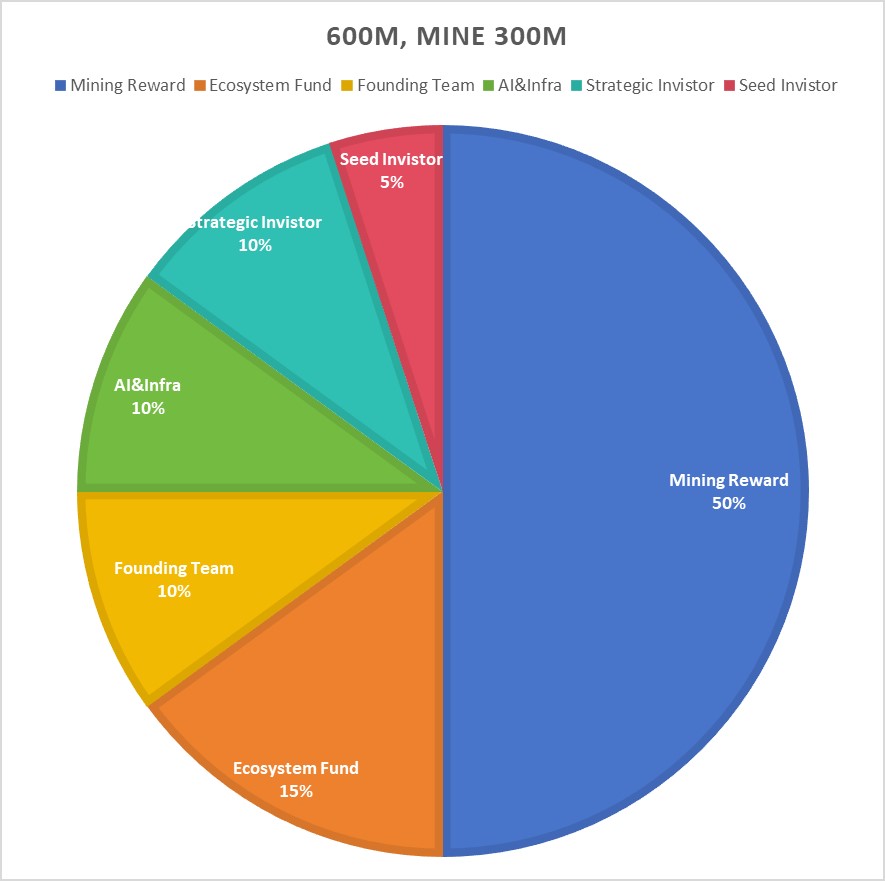
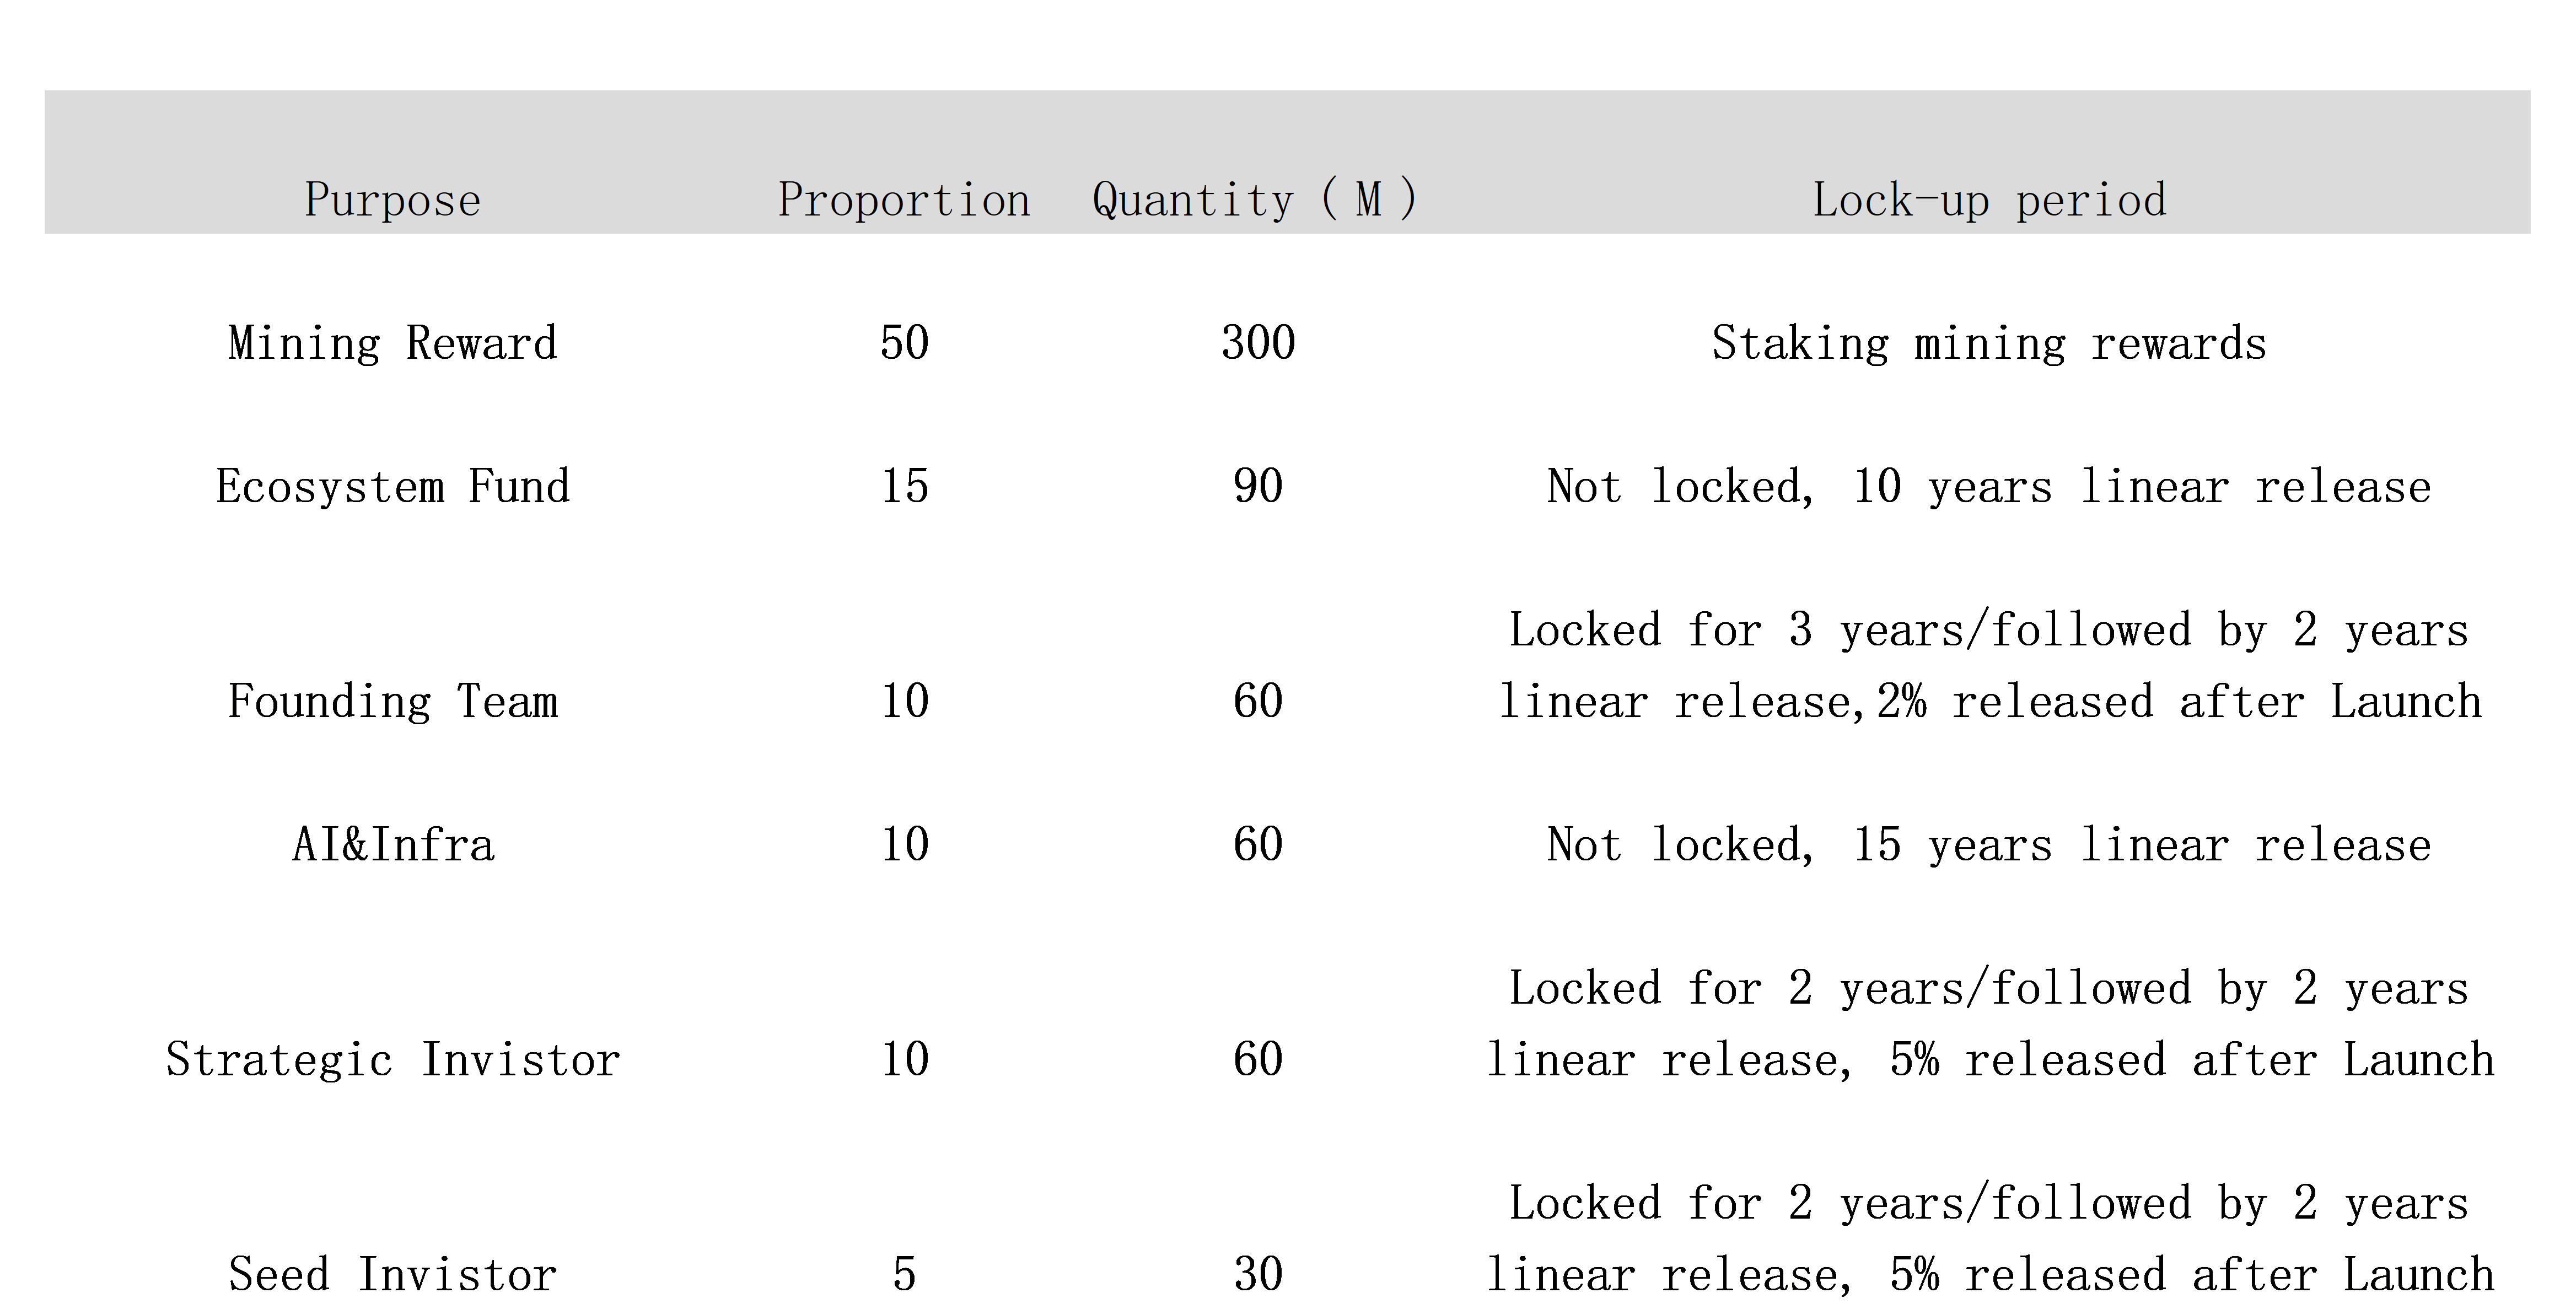
Overall token issuance: 600000000 ERB
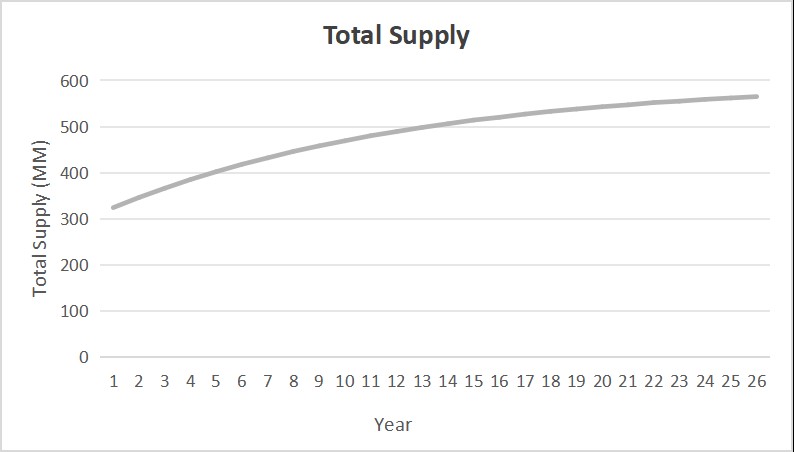
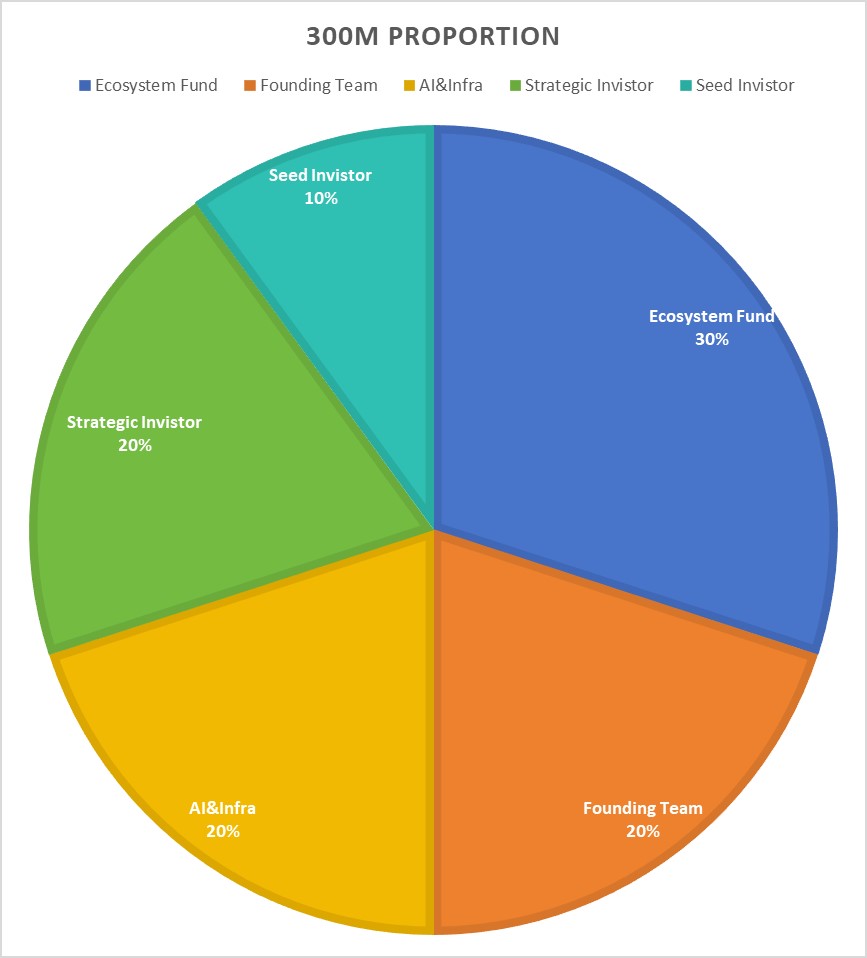
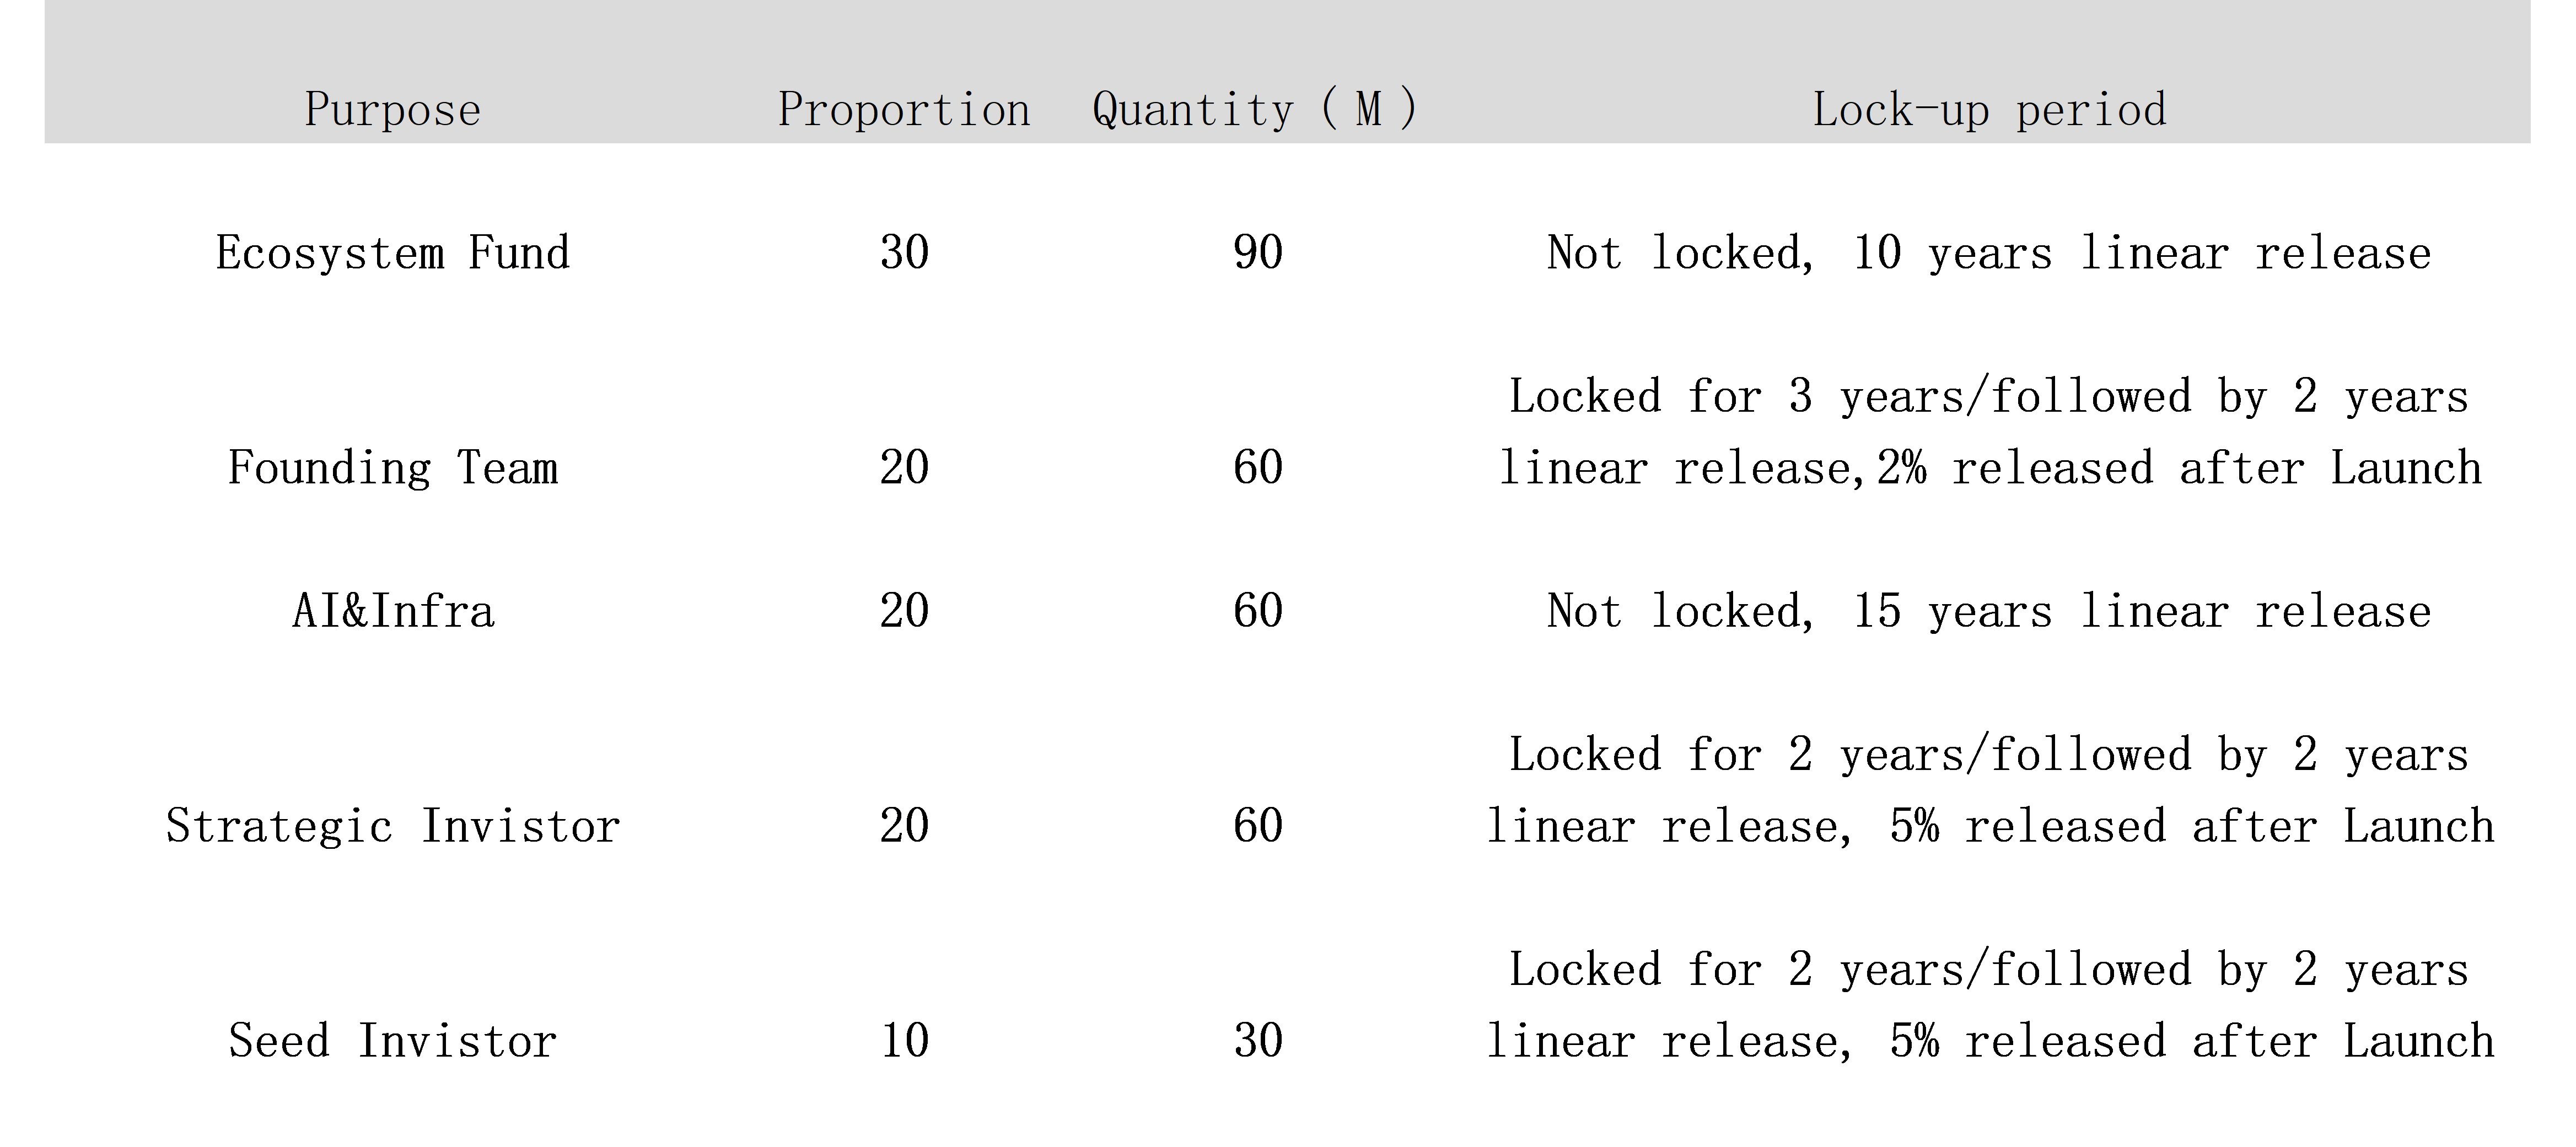
Genesis block initial circulation volume: 300000000ERB
Initial Inflation Rate: 8%
Disinflation Rate: -8%
Long-term Inflation Rate: Infinite trend 0%
These parameters define the proposed Inflation Schedule. Below we show implications of these parameters. These plots only show the impact of inflation issuances given the Inflation Schedule as parameterized above. They do not account for other factors that may impact the Total Supply such as fee/rent burning, slashing or other unforeseen future token destruction events. Therefore, what is presented here is an upper limit on the amount of ERB issued via inflation.
In the above graph we see the annual inflation rate percentage over time, given the inflation parameters proposed above.
Similarly, here we see the Total Current Supply of ERB [MM] over time, assuming an initial Total Current Supply of 300000000ERB (i.e. for this example, taking the Total Current Supply as of 2024-05-31 and simulating inflation starting from that day).
The above chart and release plan for ERB’s total issuance of 600MM and pre-allocation of 300MM will somewhat impact ERB’s circulation and market supply and demand dynamics.
